Data and statistics verified as of: February 2026
Your top-rated supplier just left you hanging.
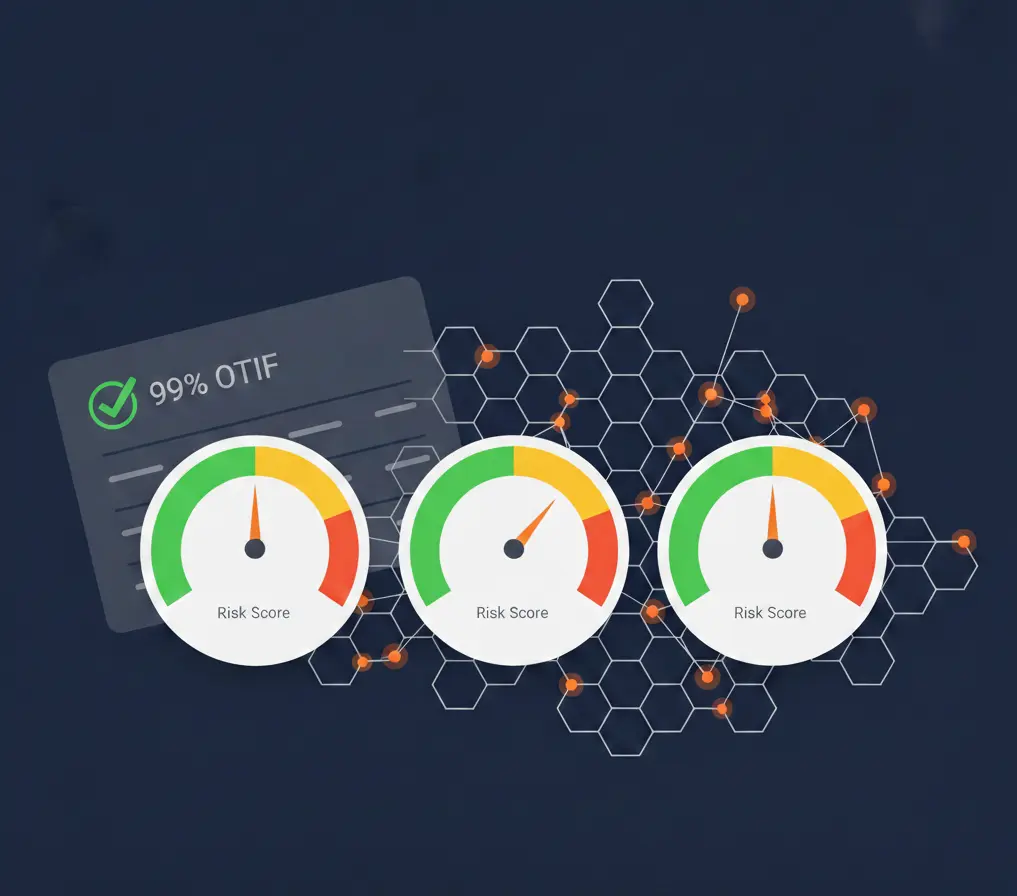
They've been your "easy button" for years - 99% OTIF, clean paperwork, never on your escalation list. You've got them flagged as Green in your scorecard. You approve the next PO without a second thought.
Then the regional news drops: a port strike is scheduled to start in two weeks.
Your ERP still says "On Track." Your supplier scorecard still says "Top Performer." Your planning team still thinks the parts are coming.
But something feels off. You email the supplier for confirmation. No reply. You nudge again. Still nothing.
Strike week hits. Containers don't move. Your line stops.
And the brutal part is this: your "perfect" OTIF history didn't fail because it was wrong. It failed because it was silent about the future.
That's what the Supplier Reliability Index (SRI) is built to fix.
Why Do Traditional OTIF Metrics Fail to Predict Risk?
OTIF (On-Time In-Full) is a scoreboard, not a radar.
It tells you what already happened. It doesn't tell you what's about to happen - especially when the next delay has nothing to do with the supplier's intent or capability.
Here's where OTIF breaks down in the real world:
- It's backward-looking by design. OTIF measures past delivery performance. Past performance can be great right up until a regional shock makes it irrelevant.
- It treats all delays the same. A hurricane, a labor action, a customs backlog, and an internal scheduling miss all collapse into one red dot.
- It's often inconsistently calculated. A case study on OTIF measurement shows how different OTIF variants can produce wildly different results, and how miscalculation can hide the real magnitude of supplier problems. See: On Time In Full (OTIF) miscalculation (Cardiff University).
- It ignores the most predictive signals - the ones that show up before the due date. Behavior changes. Communication slows. Specificity drops. Engagement fades.
Even worse: lots of teams don't actually measure the "adaptability" you need when things change. In a survey of 224 purchasing managers at Swedish manufacturing companies, researchers found that most respondents don't specifically measure supplier flexibility - they often fall back to delivery reliability, qualitative follow-ups, or can't even specify how flexibility is measured. Forslund et al., 2023.
So you end up with a scorecard that says: "They were great."
But you needed one that says: "They're about to become risky."
What Makes a Supplier Reliability Metric Predictive?
Predictive metrics don't worship history. They combine history with context and leading indicators.
If you want a score that actually helps you avoid stockouts, it has to answer three questions:
- How has this supplier performed recently, and in what conditions?
- What external risks are rising around them right now?
- Are they behaving like a supplier who's in control - or a supplier who's about to disappear?
A lot of procurement systems stop at question 1. Even "enterprise" suites like SAP Ariba and Coupa can produce supplier scorecards - but those scorecards are still mostly descriptive. They summarize outcomes. They don't continuously ingest regional risk signals and behavioral signals in a way that changes tomorrow's risk posture.
And the speed problem is real. In a 2024 survey of global supply chain leaders (run by McKinsey & Company and published via DHL), only 33% invest in early warning systems requiring real-time internal and external data integration - and responding to a new disruption takes ~2 weeks on average. DHL / McKinsey Supply Chain Risk Pulse Survey.
Two weeks is an eternity when your line goes down in 48 hours.
How Does the Supplier Reliability Index Work?
The Supplier Reliability Index (SRI) is Sotro's proprietary predictive score from 0-100 that blends three components:
- 40% Historical Latency (Past Performance)
- 30% Regional Data (External Risk Factors)
- 30% Communication Patterns (Behavioral Signals)
Not a fancy spreadsheet. Not a quarterly supplier review. A living score that updates as reality changes.
Historical Latency: What Happened Recently, Not What Happened "Ever"
SRI still respects traditional supplier performance signals, including:
- OTIF and lead time variance
- Recent delivery slippage
- Defect/return patterns (when available)
- Confirmation accuracy (what they promised vs. what arrived)
But SRI weights recency and context.
A supplier who was perfect last year but is slipping this month should not look "Green" because their annual average hides the trend.
Also - your OTIF number might not even mean what you think it means.
That same Cardiff case study shows OTIF can be computed "by line," "by quantity," "by orders," and more - producing dramatically different outputs for the same supplier. Cardiff OTIF miscalculation paper.
SRI treats historical performance as evidence, not gospel.
Regional Data: What's About to Hit Their Zip Code?
This is the piece most scorecards ignore.
SRI folds in regional disruption signals such as:
- Port strikes and labor actions
- Severe weather patterns and natural disasters
- Geopolitical instability
- Infrastructure issues
- Regional economic indicators that correlate with volatility
Why does this matter? Because regional disruptions don't care that your supplier's OTIF was 99%.
A real example: the National Association of Manufacturers warned that a strike at East and Gulf Coast ports would jeopardize $2.1B in trade daily and could reduce GDP by as much as $5B per day. NAM ports strike update and NAM letter (PDF).
That's not "a late shipment." That's systemic constraint.
Traditional systems typically mark every supplier as "Green" until orders start missing dates. SRI marks risk when the conditions for misses are forming.
Communication Patterns: What Are They Doing Before They Miss?
This is the sneaky predictor.
Suppliers rarely go from "responsive" to "missed delivery" overnight. They drift:
- Response times get longer
- Threads require more nudges
- Answers get vague ("we're checking") instead of specific ("container booked, ETD Feb 14")
- Proactive updates disappear
- Communication frequency degrades over time
Sotro can measure these signals because of its email-first approach: suppliers don't need a portal account, they just reply to normal emails. That means Sotro can observe behavioral signals without forcing adoption.
And there's academic support for the idea that communication quality affects performance. For example, an empirical study found that buyer-supplier communication choices can improve delivery-related performance outcomes. International Journal of Physical Distribution & Logistics Management.
SRI turns "communication friction" into a quantified early warning.
What Does the SRI Formula Look Like?
Conceptually:
SRI = (40% recent performance) + (30% regional risk) + (30% communication signals) Output: 0-100, where higher = more reliable, and sudden drops = action required.
No calculus. Just a practical score you can operationalize.
What Happens When 99% OTIF Meets a Port Strike?
Let's run the exact scenario that breaks OTIF.
- Supplier A: 99% OTIF historically. Looks perfect.
- Their region announces a port strike starting in 2 weeks.
- Your traditional procurement system stays Green because it only reacts to missed deliveries.
- Sotro's SRI drops fast because regional risk spikes and communication patterns shift (slower replies, less specificity).
Now the fork in the road:
Company A Uses SRI
- SRI flags the supplier as high risk immediately.
- Sotro Copilot runs overnight, marks the PO "At Risk," drafts an escalation email, and suggests a backup order.
- You place an early partial order with an alternate supplier.
- You pull a small safety buy forward.
- You survive the strike week with inventory.
Company B Uses OTIF
- They wait because OTIF says the supplier is "best-in-class."
- The strike hits. Containers stall.
- Their line stops.
What's the cost of that stockout?
A realistic industrial benchmark comes from ABB's "Value of Reliability" survey: the typical business loses close to $125,000 per hour during unplanned outages - and an eight-hour shift outage costs about $1,000,000. ABB press release.
So when we say "stockout cost," a very defensible number for many industrial operators is:
- ~$1,000,000 for a single 8-hour line stoppage
And that's before premium freight, overtime, expediting chaos, and missed downstream commitments.
OTIF didn't warn them. It couldn't.
What's the ROI of Predictive Supplier Risk Metrics?
Predictive scoring pays off in three ways:
1) You prevent the expensive kind of "surprise"
A single avoided line stop can be worth seven figures in many industrial environments, using ABB's benchmark. ABB downtime cost.
2) You stop over-buffering as your only defense
When leaders lack early warning, they default to inventory buffers.
But that's a tax you pay every day. And it still doesn't solve the "unknown unknowns" problem - it just delays it.
The DHL / McKinsey survey shows resilience progress stagnating and early warning adoption is still low (33%). That's why so many teams stay trapped between "too much inventory" and "still getting surprised." DHL / McKinsey survey PDF.
3) You reduce labor waste in PO chasing
Even if you ignore downtime, manual procurement workflows bleed time.
APQC benchmarks are frequently cited as putting the median cost to process a PO in the U.S. around $50-$100. Distribution Strategy Group citing APQC benchmarks.
Sotro's angle is simple: turn POs into active agents. Instead of humans chasing status all day, Sotro Copilot uses SRI to decide which orders deserve attention and drafts the next best action.
How Do You Operationalize SRI in Your Procurement Process?
A predictive score is useless if it lives in a dashboard nobody opens.
Here's a practical way to make SRI operational without adding bureaucracy:
1) Make SRI a daily exception list, not a monthly scorecard
- Sort open POs by SRI (lowest first)
- Filter to "SRI dropped > X points in the last 7 days"
- Review only the exceptions
This directly attacks the "2-week response cycle" problem highlighted in the DHL / McKinsey survey.
2) Attach an action policy to each risk band
Example playbook (customize per business):
- 80-100 (Green) - autopilot, light touch
- 60-79 (Yellow) - confirm dates, tighten cadence
- 40-59 (Orange) - pre-book alternates, consider partial pull-ins
- 0-39 (Red) - dual-source now, escalate, replan production
3) Use SRI to drive communication, not just judgment
This is where Sotro's email-first model matters.
Unlike portal-heavy approaches (including SourceDay and others), Sotro doesn't require suppliers to adopt a new workflow. You can CC Sotro on the PO thread and SRI starts calculating immediately - with no supplier onboarding.
When SRI drops, Sotro Copilot can:
- Draft a tighter confirmation email (specific questions, specific dates)
- Generate escalation language when needed
- Propose a re-cadence strategy based on response behavior
- Flag the "quiet supplier" before the missed date arrives
4) Use SRI for vendor rationalization with less guesswork
Traditional scorecards often lead to the wrong conclusion:
- "They're late sometimes" (but why?)
- "They're great historically" (but are they stable right now?)
SRI gives you a better signal: persistent low SRI means chronic risk, not just historical imperfections.
Can SRI Replace OTIF Entirely?
No. And it shouldn't.
OTIF still matters because it's the outcome you ultimately pay for. You want suppliers who deliver.
But OTIF alone is like driving by looking in the rear-view mirror. SRI is the windshield.
The best procurement teams run both:
- OTIF for accountability and continuous improvement
- SRI for prediction, prioritization, and prevention
Traditional Metrics vs Predictive SRI
| Dimension | Traditional OTIF / Scorecards | Predictive SRI |
|---|---|---|
| Time orientation | Backward-looking | Forward-looking |
| External factors | Usually ignored | Regional risk integrated |
| Delay context | All delays treated similarly | Delays weighted by cause signals |
| Calculation consistency | Often inconsistent across teams and definitions | Normalized scoring model |
| Early warning | None | Yes - behavioral + external signals |
| Data source | ERP and receipts | ERP + regional signals + comms behavior |
| Supplier workflow impact | Often requires portals | Email-first, no supplier onboarding |
| Operational output | Monthly review | Daily exception list + automated actions |
Frequently Asked Questions
What is the Supplier Reliability Index (SRI)?
SRI is a predictive supplier risk score (0-100) that blends recent performance (40%), regional risk (30%), and communication behavior (30%) to forecast which suppliers are likely to cause near-term disruption.
How is SRI different from OTIF?
OTIF measures past delivery outcomes. SRI predicts near-term risk by adding external context and leading behavioral signals. OTIF can also be inconsistently calculated across variants, which can distort decision-making. Cardiff OTIF paper.
What data does Sotro use to calculate regional risk?
Signals like port strikes and labor actions, weather and disaster risk, geopolitical instability indicators, infrastructure constraints, and other regional factors that correlate with near-term disruption.
Do suppliers need to log into a portal or change their workflow?
No. Sotro is email-first. Suppliers keep replying to normal emails. That's also what enables communication-pattern scoring without supplier onboarding.
How often is SRI recalculated?
Continuously as new signals arrive, and operationally it can be reviewed daily. Sotro Copilot runs overnight across active follow-ups to flag risk changes and draft actions.
What SRI score should trigger action?
It depends on your business tolerance and lead times, but the most actionable trigger is often a sudden drop (example: "down 15 points in 7 days") rather than a single absolute score.
Can SRI predict an exact delay date?
Not perfectly. It predicts risk of disruption and helps you act earlier. In practice, that's what prevents the expensive surprises.
What's a realistic cost of a single stockout event?
For many industrial operators, a stockout triggers line stoppage. ABB reports the typical business loses ~$125,000 per hour during unplanned outages, with ~$1,000,000 for an eight-hour shift. ABB survey summary.
Can I use SRI to fire underperforming suppliers?
Yes. If a supplier's SRI has been declining for 6+ months due to deteriorating communication, increasing regional risk concentration, and declining latency, that's a clear case for consolidating volume with a better alternative. Use SRI trends as the basis - not a single bad month or one missed delivery. An SRI trend shows structural issues, not temporary problems.